Introduction

Knowing how to find bottlenecks in your application is a valuable skill when trying to scale to thousands or even millions of users. Some useful techniques for achieving this goal are load testing and profiling.

In this article, we will learn how to use JMeter to load test an e-commerce application and MongoDB Profiler to find slow queries. Additionally, we will apply the Extended Reference Pattern to optimize it.

These techniques have been proven effective in one of the companies I worked for, reducing latency of endpoints by 90% and decreasing MongoDB CPU usage from 20% to 3%. The results were instrumental in enabling an e-commerce platform to handle thousands of users during a Black Friday-like event.

The e-commerce application

MongoStore is a simple e-commerce platform that operates in two regions of the world. It currently offers approximately 100,000 products in each region and has plans to expand to other locations.

The application is developed using Node.js, TypeScript, Serverless Framework, AWS, and MongoDB. Let’s examine its current implementation and architecture.

ℹ️ You can view the complete code here on GitHub along with deployment instructions.

The Product schema contains the sku, name, and description fields.

1
2
3
4
5
6
7
8
const ProductSchema = new Schema<IProduct>(
  {
    sku: { type: String, required: true },
    name: { type: String, required: true },
    description: { type: String, required: true },
  },
  { timestamps: true },
);

Each region can have multiple products, and the prices are specified per region. In this case, the schema references the sku and price fields of the product.

 1
 2
 3
 4
 5
 6
 7
 8
 9
10
11
12
13
const RegionSchema = new Schema<IRegion>(
  {
    name: { type: String, required: true, index: true, unique: true },
    products: [
      {
        _id: { id: false },
        sku: { type: String, required: true },
        price: { type: Number, required: true },
      },
    ],
  },
  { timestamps: true },
);

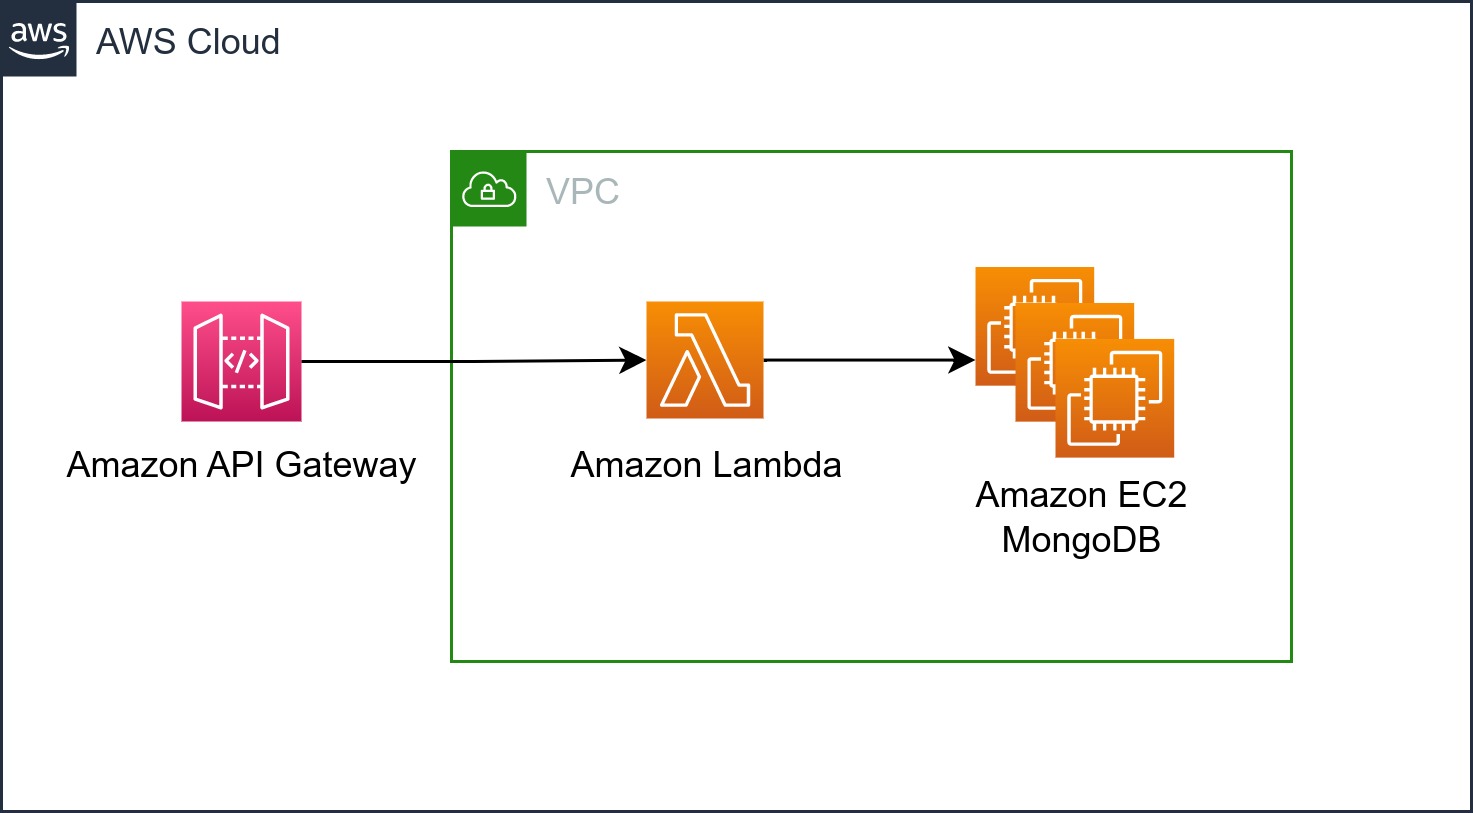
For its architecture, the application uses a MongoDB Cluster hosted on 3 EC2 instances. The servers employ AWS Lambda and are behind an API Gateway.

With this configuration, MongoStore can scale the backend servers using AWS Lambda. However, the database can still present scalability challenges since it does not scale automatically. Note: Auto-scaling has intentionally not been set up to identify database bottlenecks more effectively.

AWS Architecture Image

Profiling with MongoDB

Users have reported that the website is down, and CloudWatch data confirms that the database CPU usage has reached 100%. Consequently, it is likely that a database query is causing the issue.

To investigate further, you can utilize the MongoDB Database Profiler . The profiler collects data from MongoDB queries that exceed a specific threshold and stores it in the system.profile collection.

Connect to the primary MongoDB instance and use Mongo Shell to execute the following command, which sets the data collection threshold to 100 ms:

 1
 2
 3
 4
 5
 6
 7
 8
 9
10
11
12
13
14
15
db.setProfilingLevel(1, 100)
{
        "was" : 0,
        "slowms" : 100,
        "sampleRate" : 1,
        "ok" : 1,
        "$clusterTime" : {
                "clusterTime" : Timestamp(1683765280, 1),
                "signature" : {
                        "hash" : BinData(0,"AAAAAAAAAAAAAAAAAAAAAAAAAAA="),
                        "keyId" : NumberLong(0)
                }
        },
        "operationTime" : Timestamp(1683765280, 1)
}

Now, retrieve the queries that have been executed and took longer than the threshold.

  1
  2
  3
  4
  5
  6
  7
  8
  9
 10
 11
 12
 13
 14
 15
 16
 17
 18
 19
 20
 21
 22
 23
 24
 25
 26
 27
 28
 29
 30
 31
 32
 33
 34
 35
 36
 37
 38
 39
 40
 41
 42
 43
 44
 45
 46
 47
 48
 49
 50
 51
 52
 53
 54
 55
 56
 57
 58
 59
 60
 61
 62
 63
 64
 65
 66
 67
 68
 69
 70
 71
 72
 73
 74
 75
 76
 77
 78
 79
 80
 81
 82
 83
 84
 85
 86
 87
 88
 89
 90
 91
 92
 93
 94
 95
 96
 97
 98
 99
100
101
102
103
db.system.profile.find().pretty()
{
        "op" : "command",
        "ns" : "database.regions",
        "command" : {
                "aggregate" : "regions",
                "pipeline" : [
                        {
                                "$match" : {
                                        "_id" : ObjectId("645c38d52f5c6ee098f9a392")
                                }
                        },
                        {
                                "$unwind" : "$products"
                        },
                        {
                                "$lookup" : {
                                        "from" : "products",
                                        "localField" : "products.sku",
                                        "foreignField" : "sku",
                                        "as" : "products.product"
                                }
                        },
                        {
                                "$unwind" : "$products.product"
                        },
                        {
                                "$limit" : 100
                        },
                        {
                                "$project" : {
                                        "_id" : "$products.product._id",
                                        "sku" : "$products.product.sku",
                                        "name" : "$products.product.name",
                                        "description" : "$products.product.description",
                                        "price" : "$products.price"
                                }
                        }
                ],
                "cursor" : {

                },
                "lsid" : {
                        "id" : UUID("d3e2a4d9-4970-4d80-917f-384be47acbd8")
                },
                "$clusterTime" : {
                        "clusterTime" : Timestamp(1684015798, 1),
                        "signature" : {
                                "hash" : BinData(0,"AAAAAAAAAAAAAAAAAAAAAAAAAAA="),
                                "keyId" : NumberLong(0)
                        }
                },
                "$db" : "database"
        },
        "keysExamined" : 1,
        "docsExamined" : 20000001,
        "cursorExhausted" : true,
        "numYield" : 20000,
        "nreturned" : 100,
        "queryHash" : "5B7E4F14",
        "planCacheKey" : "8928FB1D",
        "locks" : {
                "FeatureCompatibilityVersion" : {
                        "acquireCount" : {
                                "r" : NumberLong(20203)
                        }
                },
                "ReplicationStateTransition" : {
                        "acquireCount" : {
                                "w" : NumberLong(1)
                        }
                },
                "Global" : {
                        "acquireCount" : {
                                "r" : NumberLong(20203)
                        }
                },
                "Mutex" : {
                        "acquireCount" : {
                                "r" : NumberLong(202)
                        }
                }
        },
        "flowControl" : {

        },
        "readConcern" : {
                "level" : "local",
                "provenance" : "implicitDefault"
        },
        "writeConcern" : {
                "w" : "majority",
                "wtimeout" : 0,
                "provenance" : "implicitDefault"
        },
        "storage" : {

        },
        "responseLength" : 21893,
        "protocol" : "op_msg",
        "millis" : 12095,
        "planSummary" : "IDHACK"
}

The whole operation took 12 seconds and by the variables keysExamined and docsExamined we can see that it only checked one index key and went through millions of documents.

After some investigation, we noticed that we forgot to add the sku index to our products collection. Let’s do it.

1
2
3
4
5
6
7
8
const ProductSchema = new Schema<IProduct>(
  {
    sku: { type: String, required: true, index: true, unique: true },
    name: { type: String, required: true },
    description: { type: String, required: true },
  },
  { timestamps: true },
);

Now, let’s set the threshold to a lower time to get the results. But, first, clear the db.system.profile database by disabling the profiler and enabling again.

1
2
3
db.setProfilingLevel(0) # disable profile
db.system.profile.drop() # drop profile database
db.setProfilingLevel(1, 10) # set threshold to 10ms
  1
  2
  3
  4
  5
  6
  7
  8
  9
 10
 11
 12
 13
 14
 15
 16
 17
 18
 19
 20
 21
 22
 23
 24
 25
 26
 27
 28
 29
 30
 31
 32
 33
 34
 35
 36
 37
 38
 39
 40
 41
 42
 43
 44
 45
 46
 47
 48
 49
 50
 51
 52
 53
 54
 55
 56
 57
 58
 59
 60
 61
 62
 63
 64
 65
 66
 67
 68
 69
 70
 71
 72
 73
 74
 75
 76
 77
 78
 79
 80
 81
 82
 83
 84
 85
 86
 87
 88
 89
 90
 91
 92
 93
 94
 95
 96
 97
 98
 99
100
101
102
103
db.system.profile.find().pretty()
{
        "op" : "command",
        "ns" : "database.regions",
        "command" : {
                "aggregate" : "regions",
                "pipeline" : [
                        {
                                "$match" : {
                                        "_id" : ObjectId("645c38d52f5c6ee098f9a392")
                                }
                        },
                        {
                                "$unwind" : "$products"
                        },
                        {
                                "$lookup" : {
                                        "from" : "products",
                                        "localField" : "products.sku",
                                        "foreignField" : "sku",
                                        "as" : "products.product"
                                }
                        },
                        {
                                "$unwind" : "$products.product"
                        },
                        {
                                "$limit" : 100
                        },
                        {
                                "$project" : {
                                        "_id" : "$products.product._id",
                                        "sku" : "$products.product.sku",
                                        "name" : "$products.product.name",
                                        "description" : "$products.product.description",
                                        "price" : "$products.price"
                                }
                        }
                ],
                "cursor" : {

                },
                "lsid" : {
                        "id" : UUID("cbbc0d5c-c35b-4428-8af6-d8b4a8ac0bd0")
                },
                "$clusterTime" : {
                        "clusterTime" : Timestamp(1684015558, 1),
                        "signature" : {
                                "hash" : BinData(0,"AAAAAAAAAAAAAAAAAAAAAAAAAAA="),
                                "keyId" : NumberLong(0)
                        }
                },
                "$db" : "database"
        },
        "keysExamined" : 101,
        "docsExamined" : 101,
        "cursorExhausted" : true,
        "numYield" : 0,
        "nreturned" : 100,
        "queryHash" : "5B7E4F14",
        "planCacheKey" : "2FBA11A3",
        "locks" : {
                "FeatureCompatibilityVersion" : {
                        "acquireCount" : {
                                "r" : NumberLong(203)
                        }
                },
                "ReplicationStateTransition" : {
                        "acquireCount" : {
                                "w" : NumberLong(1)
                        }
                },
                "Global" : {
                        "acquireCount" : {
                                "r" : NumberLong(203)
                        }
                },
                "Mutex" : {
                        "acquireCount" : {
                                "r" : NumberLong(202)
                        }
                }
        },
        "flowControl" : {

        },
        "readConcern" : {
                "level" : "local",
                "provenance" : "implicitDefault"
        },
        "writeConcern" : {
                "w" : "majority",
                "wtimeout" : 0,
                "provenance" : "implicitDefault"
        },
        "storage" : {

        },
        "responseLength" : 21893,
        "protocol" : "op_msg",
        "millis" : 29,
        "planSummary" : "IDHACK
}

After adding the necessary index, the execution time dramatically reduced to only 29 milliseconds. Additionally, the number of keys and documents examined also decreased significantly. That is a lot better! And finally, our users have stopped seeing crashes in the app.

Load testing with jMeter

Now that we fixed the bottleneck we had, we are confident that our system can handle thousands of users in a Black Friday, right? … WRONG!

Improving just one endpoint and a database query does not guarantee we can handle the load we are expecting. One effective tool for load testing is Apache JMeter , which can simulate multiple users accessing and making requests to the system simultaneously.

In this scenario, let’s assume we are expecting 10,000 users are expected, with each user making approximately 1 request every 10 seconds to the endpoint responsible for fetching products. This translates to a requirement of 1,000 requests per second.

To validate the system’s ability to handle this expected throughput, follow these steps:

  1. Retrieve the ID of one of the regions using cURL .
1
2
curl https://3mspdgu8cb.execute-api.us-east-1.amazonaws.com/staging/regions
{"regions":[{"_id":"645c38d52f5c6ee098f9a392","name":"Alaska"},{"_id":"645c39102f5c6ee098fcb0e9","name":"Rio"}]}
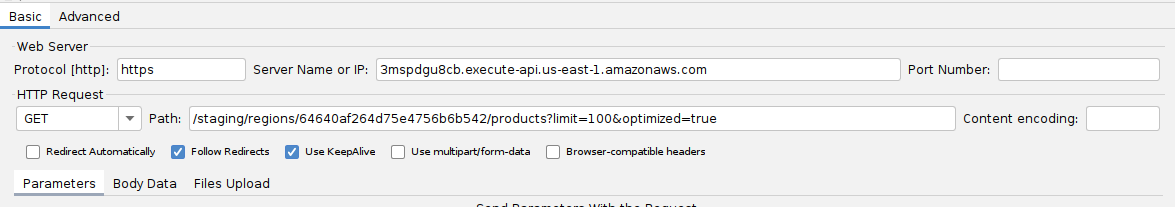
  1. Use the provided endpoint to fetch 100 products from the Alaska region.
1
https://3mspdgu8cb.execute-api.us-east-1.amazonaws.com/staging/regions/645c38d52f5c6ee098f9a392/products\?limit\=100
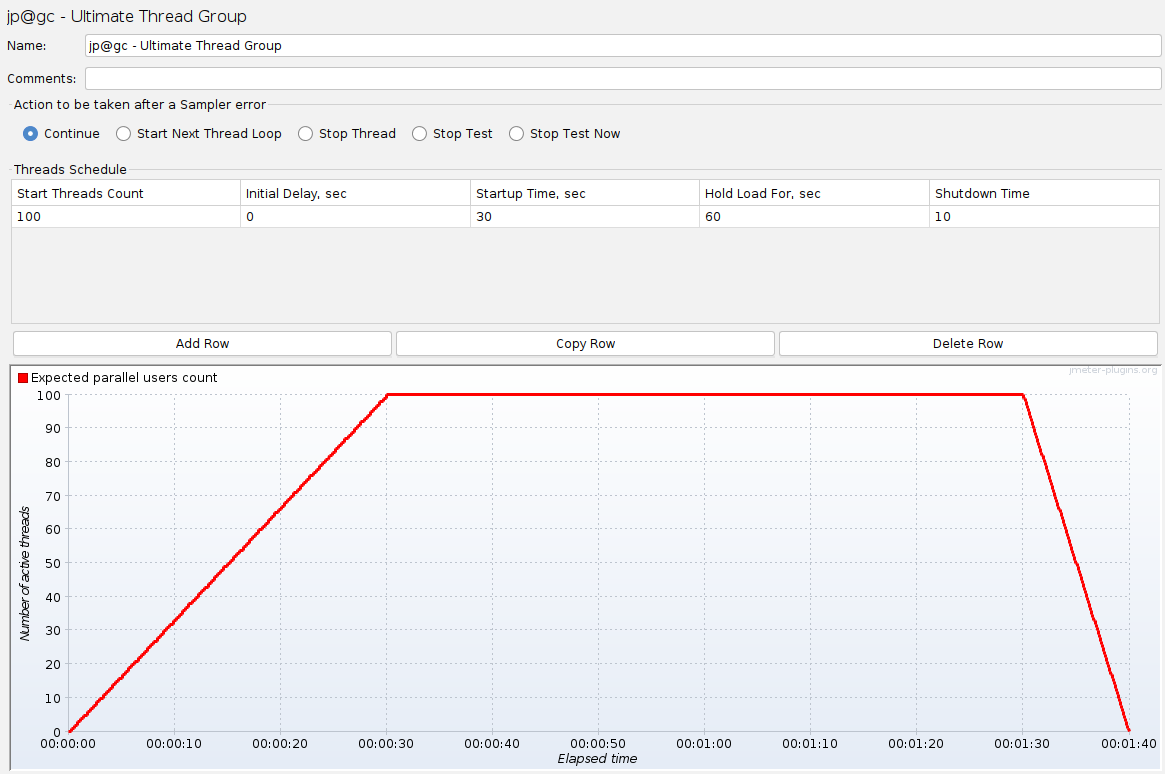
  1. Create a Test Plan in JMeter using the Ultimate Thread Group plugin . Configure it to simulate 100 threads with a 30-second startup time, holding the load for 60 seconds.

Ultimate Thread Group Screenshot

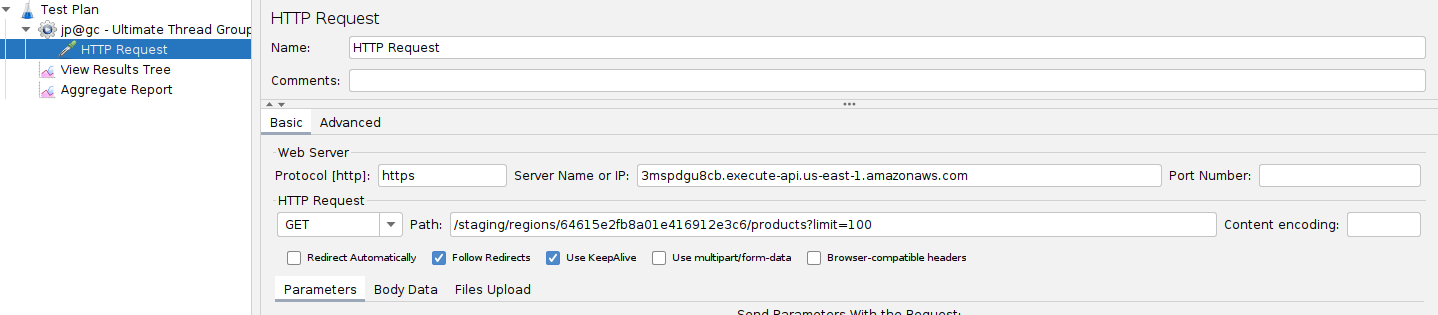
  1. Configure the HTTP Request sampler in JMeter to target the appropriate endpoint. Additionaly, add the View Results Tree and Aggregate Report.

HTTP Request Sampler

  1. Run the load tests.

Aggregate Report

View Results Tree

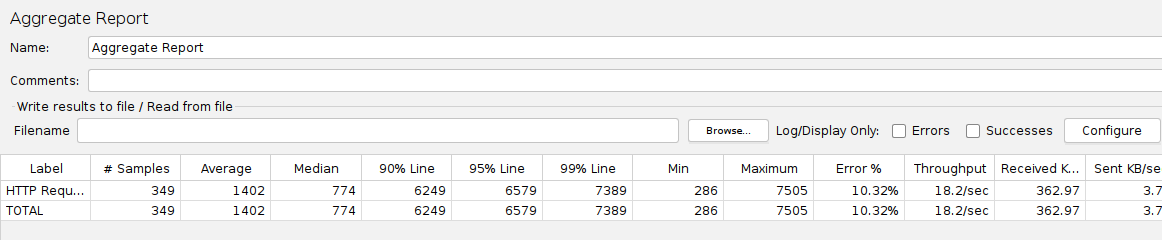
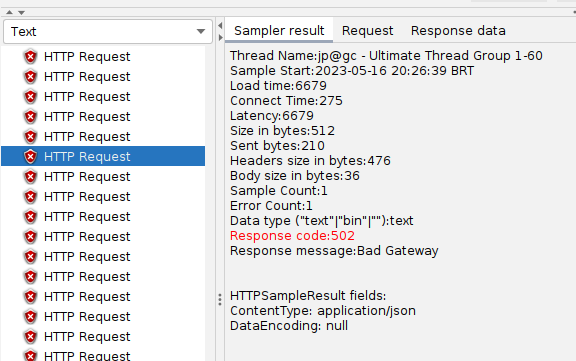
Upon executing the load tests, it is observed that the system only reaches approximately 20 requests per second before encountering 502 (Bad Gateway) errors.

What does this mean? If we SSH into the machine and run sudo service mongod status we can see that the mongod service crashed, meaning it couldn’t handle the load.

1
2
3
4
5
[ec2-user@ip-10-0-0-100 ~]$ sudo service mongod status
Redirecting to /bin/systemctl status mongod.service
● mongod.service - MongoDB Database Server
   Loaded: loaded (/usr/lib/systemd/system/mongod.service; enabled; vendor preset: disabled)
   Active: failed (Result: exit-code) since Tue 2023-05-16 23:28:20 UTC; 474ms ago

The question is, but our query is already using the correct indexes, it is not doing a Collection Scan, and it is executing in 29ms. Can we do better than this? Yes!

The Extended Reference Pattern

When working with NoSQL databases, it is essential to understand that JOIN operations tend to be slow. In the context of this application, the $lookup step performed a join, negatively impacting the performance.

To mitigate this, it is valuable to be aware of the Extended Reference Pattern . This pattern involves copying only the necessary data into the collection, eliminating the need for joins and allowing querying a single collection for the required information.

It is also important to know that our first implementation had one drawback: having an array of products does not scale, because there is a limit of 16MB per document . Imagine if we had millions of products in each region? That array would grow quickly.

To address these concerns, the Extended Reference Pattern can be applied by embedding the regions and prices directly into the products collection. This design change involves introducing a new array, regions, which contains the _id of the region and the corresponding product’s price in that region.

 1
 2
 3
 4
 5
 6
 7
 8
 9
10
11
12
13
14
const ProductSchema = new Schema<IProduct>(
  {
    sku: { type: String, required: true, index: true, unique: true },
    name: { type: String, required: true },
    description: { type: String, required: true },
    regions: [
      {
        _id: { type: Schema.Types.ObjectId, required: true, index: true },
        price: { type: Number, required: true },
      },
    ],
  },
  { timestamps: true },
);

The application’s endpoint has been modified to utilize a new aggregate query that only queries the products collection, eliminating the need for additional lookups.

 1
 2
 3
 4
 5
 6
 7
 8
 9
10
11
12
13
14
15
16
17
18
19
20
21
22
23
24
25
export async function getProductsOptimized(
  regionId: string,
  limit: string | number,
): Promise<IProduct[]> {
  const mongoRegionId = new mongoose.Types.ObjectId(regionId);
  return Product.aggregate([
    { $match: { regions: { $elemMatch: { _id: mongoRegionId } } } },
    { $limit: Number(limit) },
    {
      $unwind: '$regions',
    },
    {
      $match: { 'regions._id': mongoRegionId },
    },
    {
      $project: {
        _id: 1,
        sku: 1,
        name: 1,
        description: 1,
        price: '$regions.price',
      },
    },
  ]);
}

Upon retesting the endpoint with the optimized query using the optimized=true query string parameter, the system demonstrates a significant improvement. The aggregate report shows that the throughput has increased to 80 requests per second, representing a 400% improvement.

HTTP Request Sampler

Aggregate Report

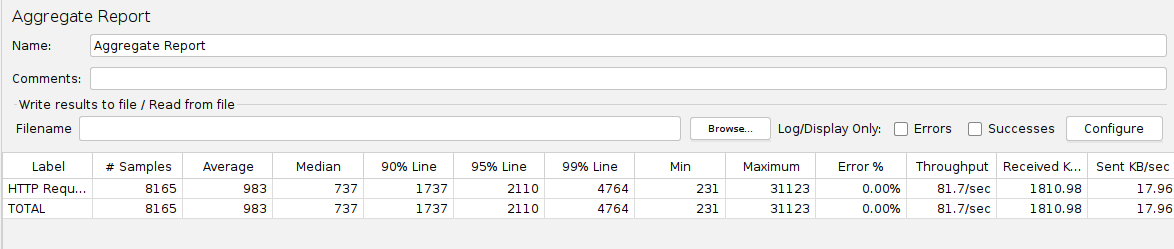
While this improvement is substantial, it is still short of the required throughput of 1,000 requests per second. To handle such loads, additional strategies can be employed, such as vertically scaling the EC2 instances by adding more CPU and RAM, distributing the load across multiple replicas, or even sharding the database.

Conclusion

By utilizing MongoDB’s profiling capabilities for query optimization, load testing with tools like Apache JMeter, and applying effective design patterns like the Extended Reference Pattern, it is possible to significantly improve the performance and scalability of the application.

Additionally, implementing observability practices, including monitoring, logging, and alerting, allows for proactive identification and resolution of performance bottlenecks.